Using KPI table widgets
What are KPI tables?
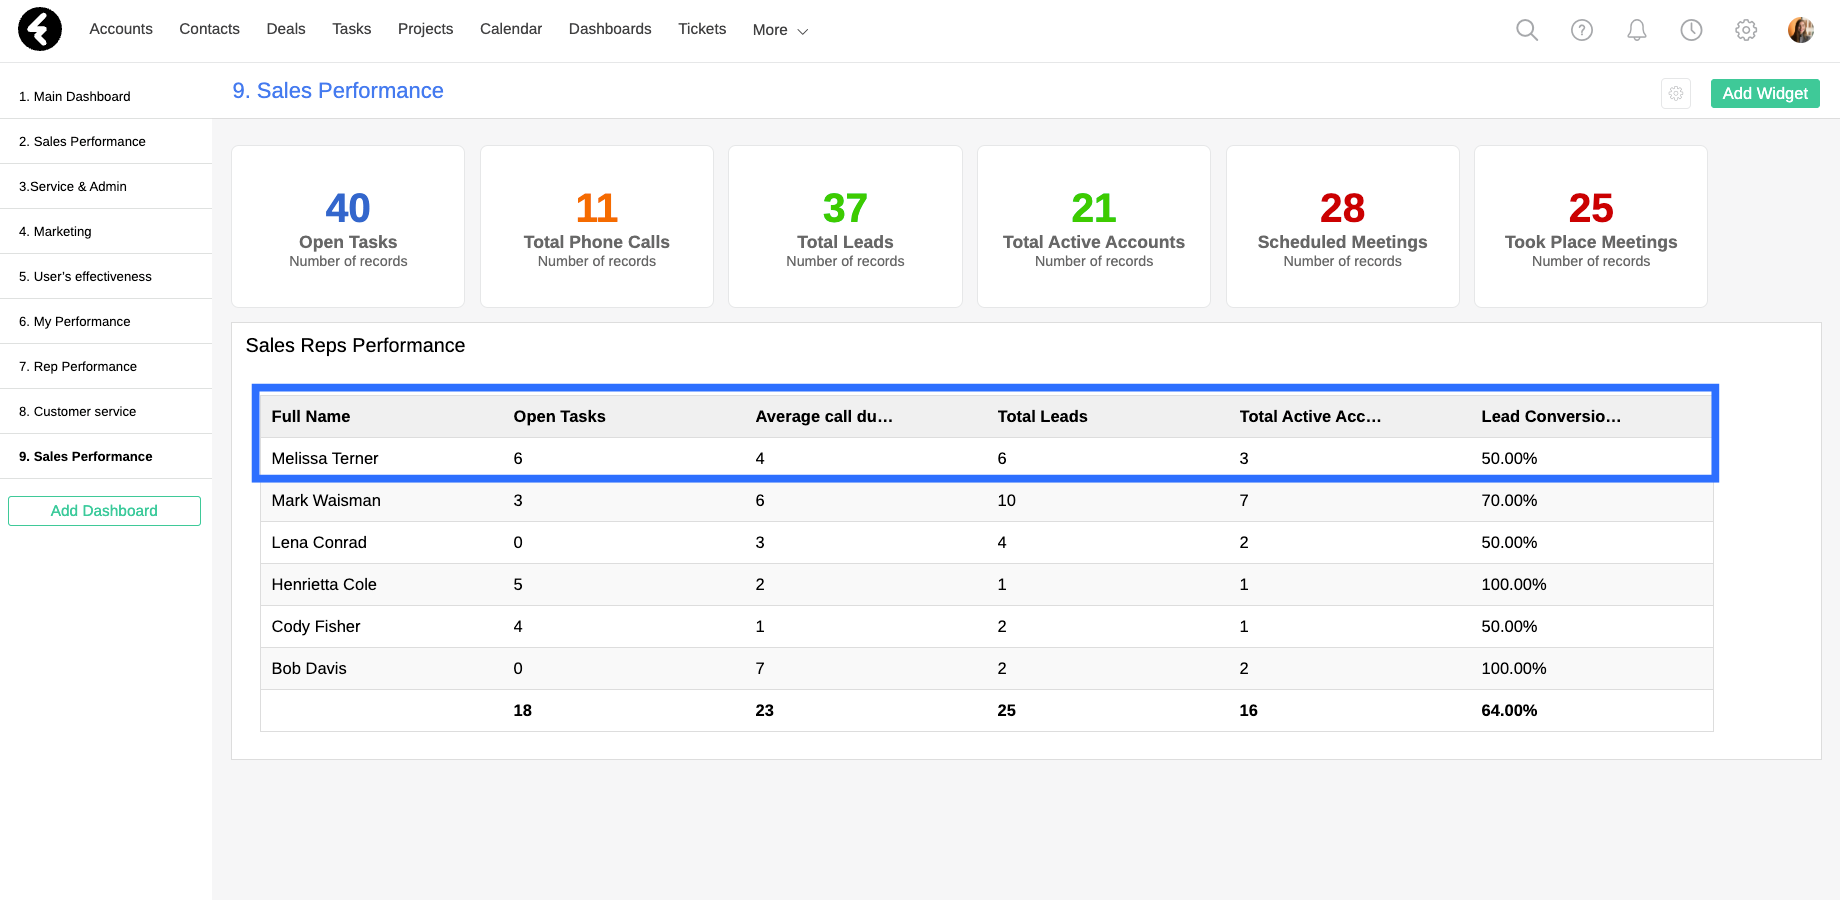
Key Performance Indicators, or KPIs, are visual measures of how well a business is performing. Using different KPI types, you can measure success based on specific business targets. The KPI table widget lets you show multiple parameters from different objects all in one table, and even display calculations using these parameters. When these parameters are calculated together, you can gain powerful insights into the performance of your business. For example, you can create a KPI table widget which displays the performance of your sales reps. You can show the amount of projects the user is in charge of, how many tasks the user has open, the conversion rate of the user’s leads to active accounts, and so much more. Follow the steps below to learn how.
Preliminary steps
KPI tables are made up of parameter widgets. Before creating your KPI table, you’ll first need to create the parameters which you’d like to use within your table, such as open tasks, weekly leads, and more. You can learn how to create parameter widgets here.
When creating these parameters, you’ll need to make sure the data type set for the parameter is related to the data type you set for your KPI table. Continuing the above example, the sales rep performance table will be set to the Users data type; below you can find an in depth explanation of how to choose the proper object. Because the KPI table’s data type is set to the users object, any parameter which you’d like to include in this table will need to have its Data Type field set to an object which is related to the users object.

For example, the Assigned to lookup field relates the tasks object to the users object, and will allow you to use the Open Tasks parameter within the sales rep performance KPI table. This will allow your table to present the specific amount of open tasks for each sales rep. You can learn more about object relationships here. Once you’ve created all the parameter widgets you’d like to use within your KPI table, you can begin building your table.
Creating a KPI table
Now that you’ve prepared your parameters, you can start building your KPI table widget. First open the dashboard you’d like to add your KPI table to, and then click the Add Widget button. Next select the KPI Table option.
You can now set up the basic fields under the Chart Title section.
Data Type
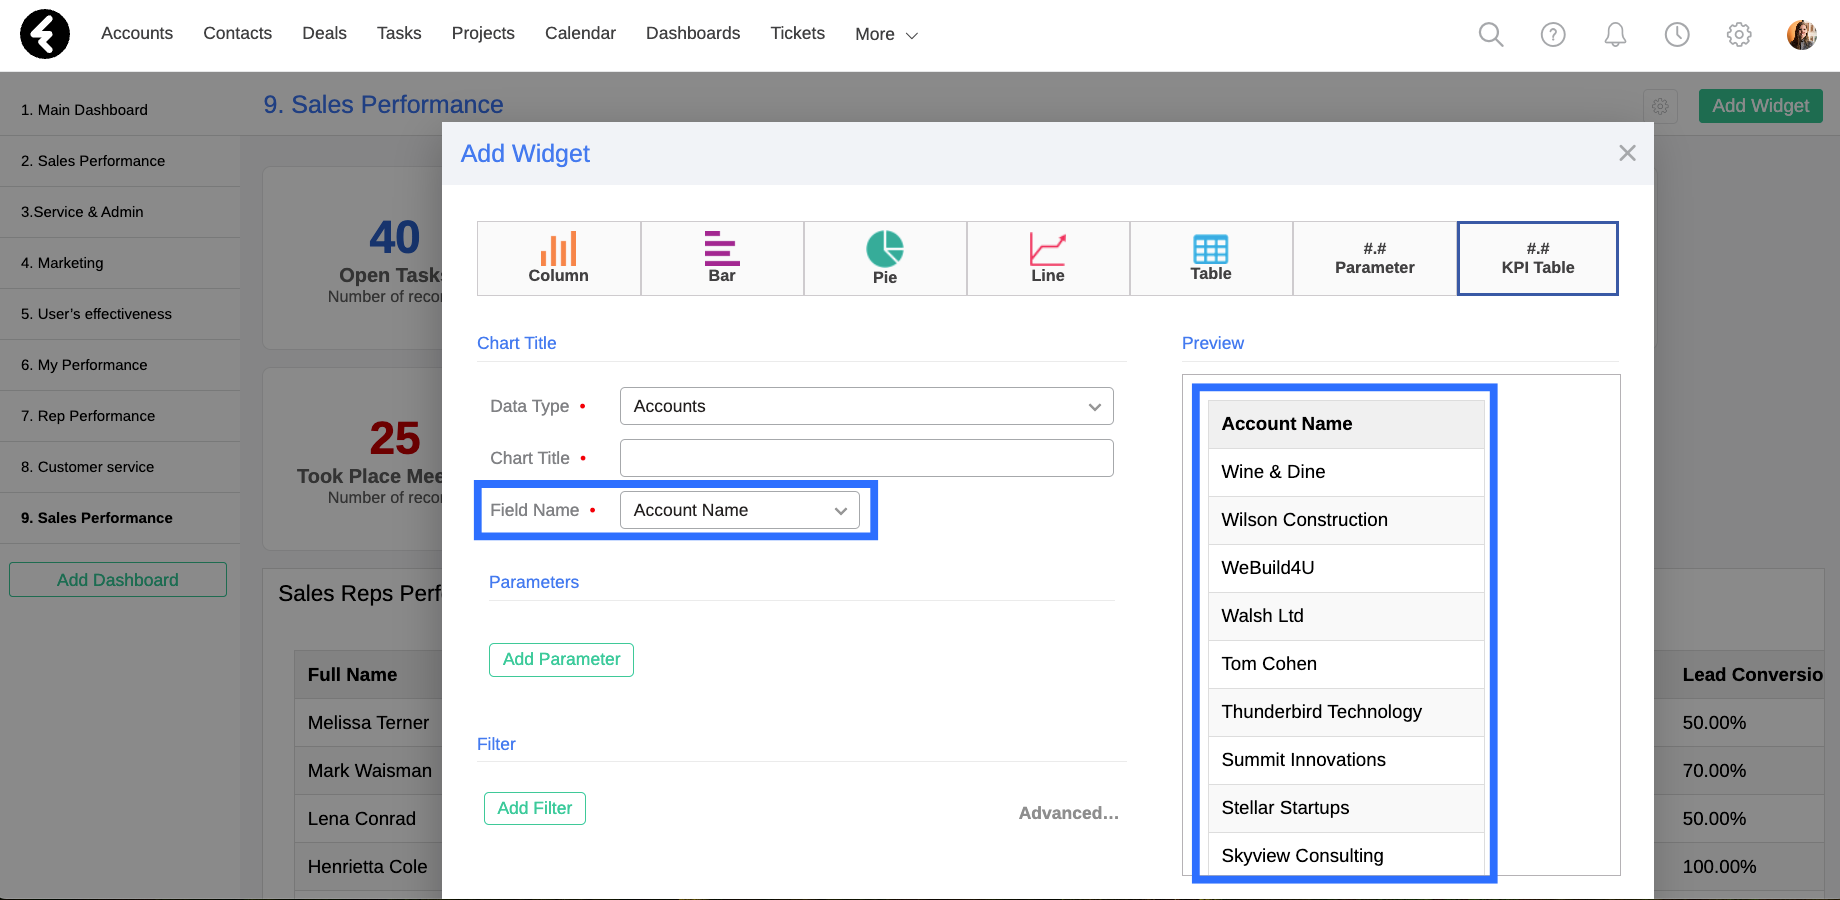
First, you’ll need to select the Data Type for your table, which is the object your table will show information about. Each row in your KPI table will be a single record within the object you select here. For example, if you select the Users object, a row will be created in your table for each system user, and the data in their corresponding row will provide information relating to this user. If you instead select the Accounts data type, a row will be created for each account record in your system, and include information about the corresponding account. You can use the Preview section on the right to see the rows which will be included in your KPI table.
Chart Title
Next set the Chart Title to the title you’d like to display on top of your table. By using a specific and descriptive title here, such as Sales Reps Performance, you’ll improve the readability of your dashboard and help users easily understand the purpose of your table.
Field Name
Finally, open the Field Name dropdown, where you can select the row headers for your table. This will set both the name of the row headers, and which rows will be displayed. You can choose from two different options. The first is the primary field of the selected object, which you can learn about here and is frequently the name field. By selecting the primary field, such as Account Name, a row will be created for each record within the selected object and the value of the primary field will be displayed for each row.
The second option includes all the different picklist fields within the selected object. For example, if you chose the Accounts object you may see the Status, Industry, and Lead Source picklist fields, along with any other picklist fields within the accounts object. By selecting a picklist field, such as the Status field, you’ll see a row for each option within the picklist, such as New, Qualification, and so on. The data within each row will be the cumulative data of all the records with the selected picklist option. For example, if your table contains the Open Tasks parameter and you’ve selected the Status field, the New row will show the cumulative amount of open tasks for all of the account records whose statuses are set to new. If you instead select the Account Type picklist in the Field Name, your table will show the different options within the account type field. You can learn more about picklist fields here.
Parameters
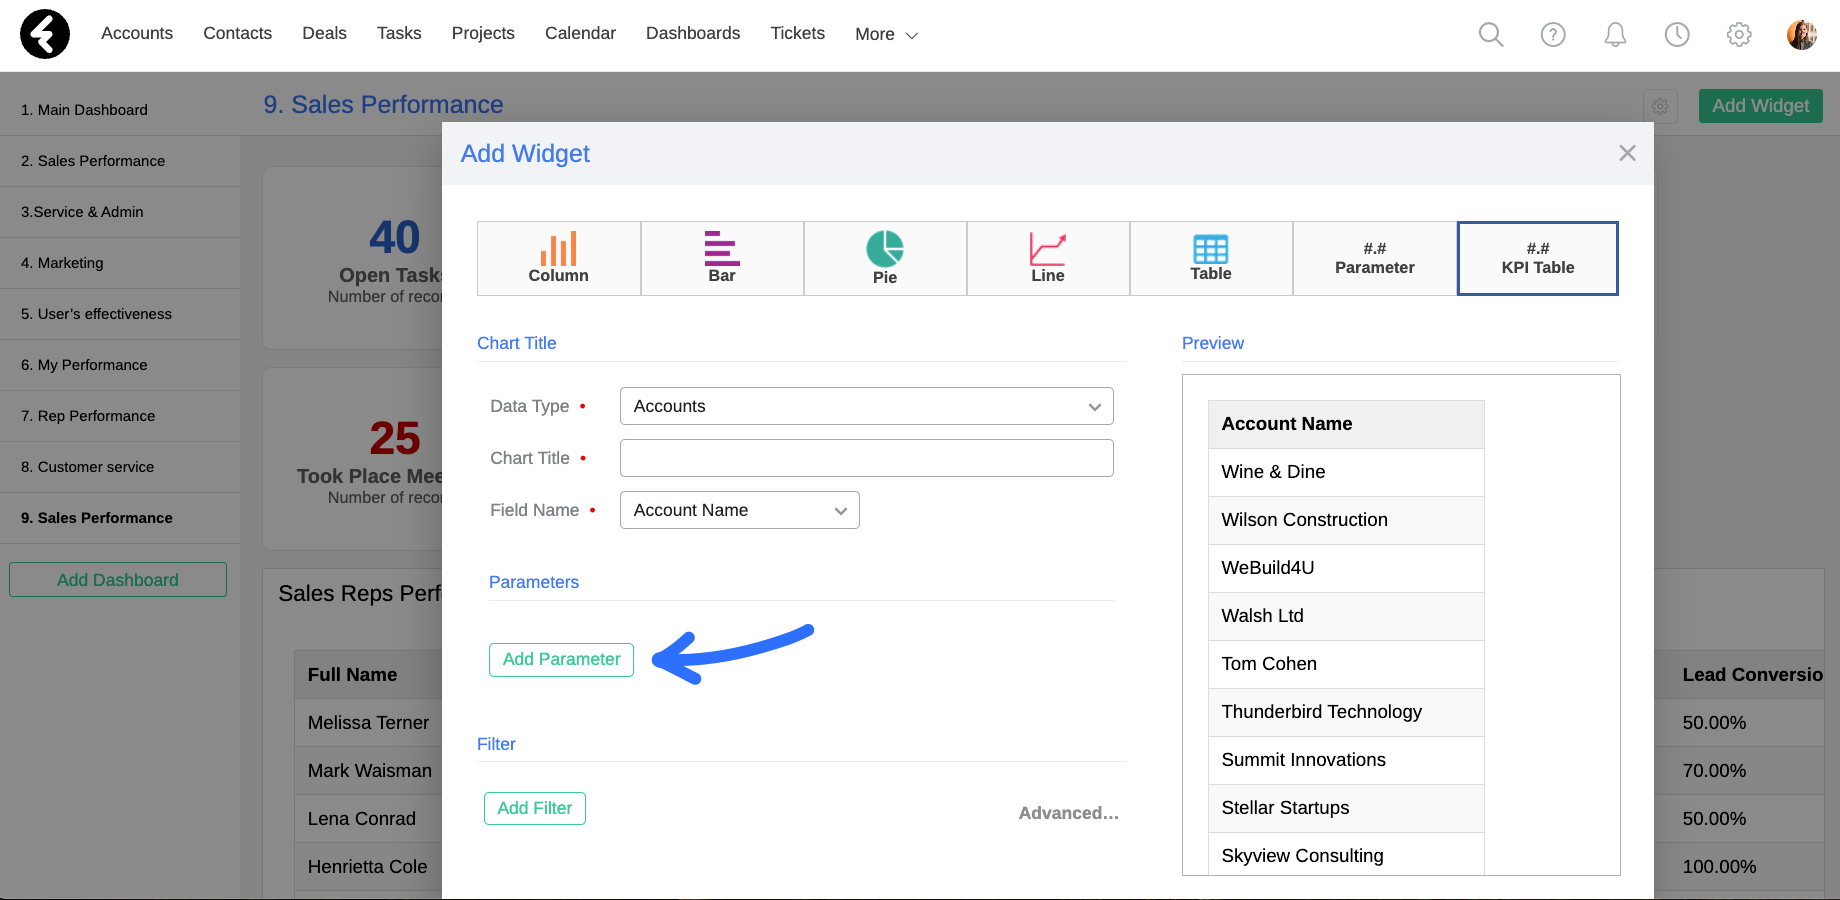
Once you’ve set the basic information for your chart, you can start adding your parameters. First click the Add Parameter button to open a pop up where you can add a new parameter to your table.
Select Parameter
Next choose whether you’d like to add a parameter or a formula. To learn about creating formulas, read the section below. If you’ve selected the Parameter option, you’ll see two fields. The first is the Select Parameter field. Here you can choose from any of your existing parameters which belong to a data type which is related to the data type of your table, as was explained above. Click on a parameter to add it as a column in your table. Note that the Parameter Name will automatically fill in with the name of the parameter you selected, you can of course change this name to anything you’d like.
Value Type
Here you can choose how you’d like your values displayed, there are three options:
- Integer: Displays numbers with no decimal, this is good for numerically whole data like the number of new leads.
- Decimal: Displays numbers including decimals, this is good for numerically exact data like annual revenue in USD.
- Percent: Displays the percentage, this is good for formula outcomes like conversion rates.
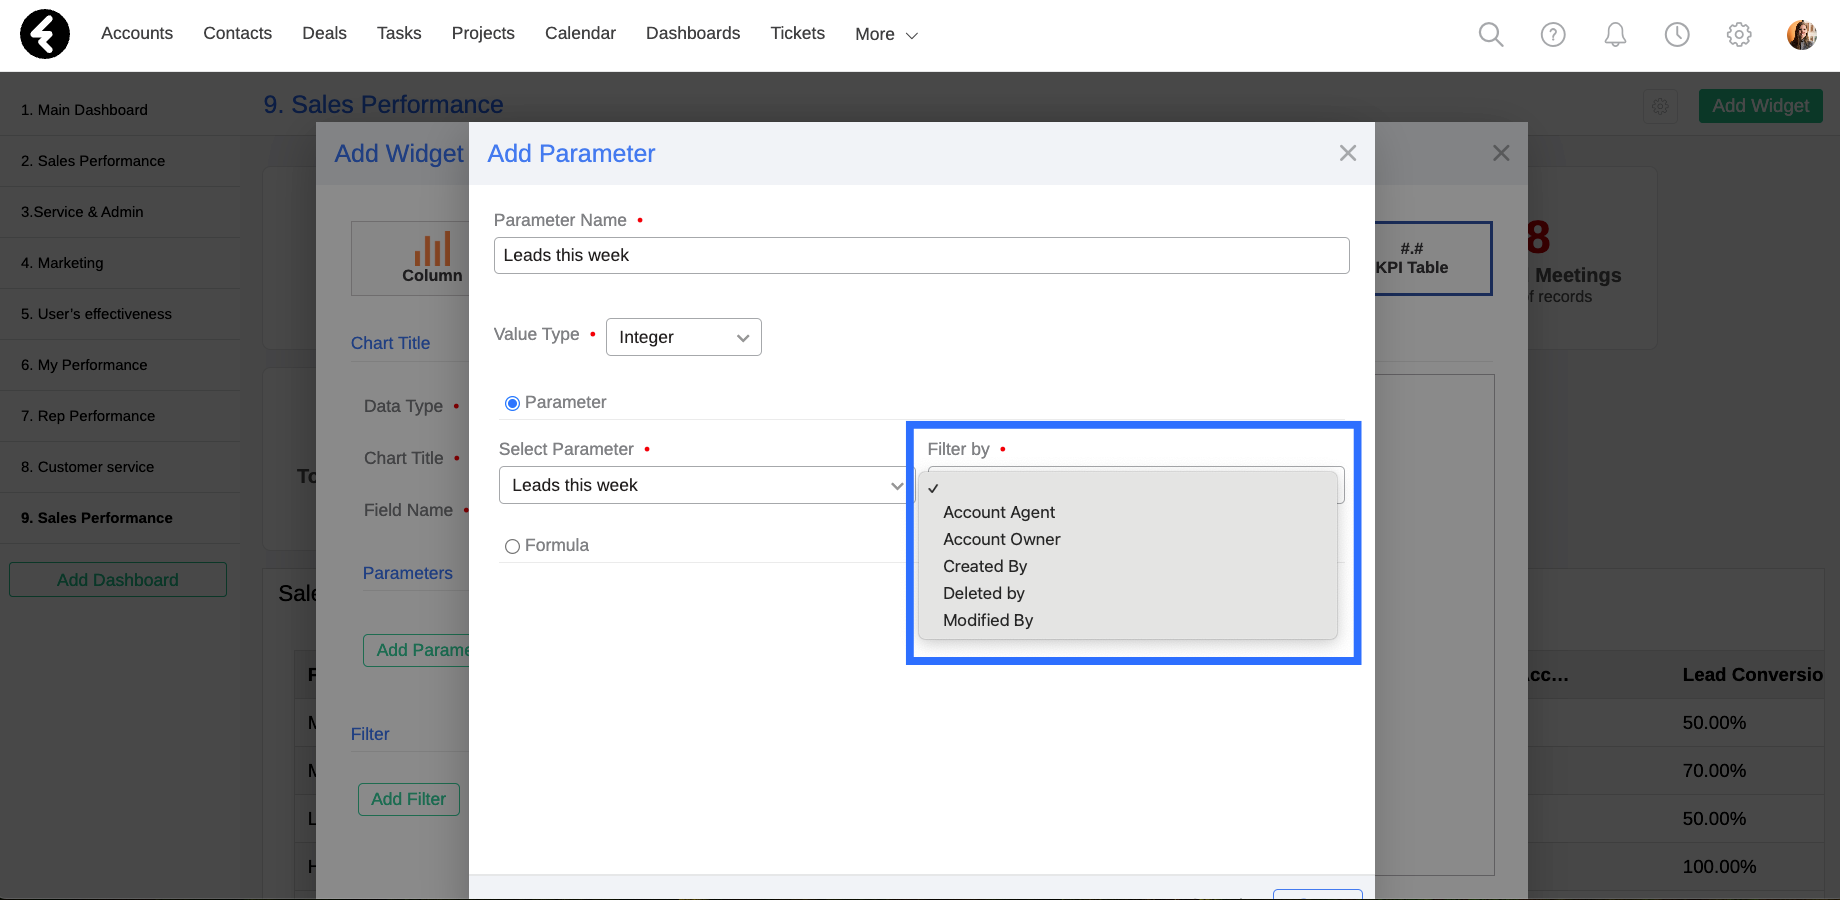
Filter by
Once you’ve selected a parameter, open the Filter by field to open a dropdown list of all the lookup fields within the parameter’s data type which relate to the data type of your KPI table. For example, if your table uses the Users object and you select the Leads this week parameter, which belongs to the accounts object, the Filter by field will show all the lookup fields which relate from accounts to users, such as Account Owner and Created By. The lookup field you select here will set which values are displayed for each row. Continuing our example, if you select Account Owner then the Leads this week column will display how many accounts each user is set as the account owner for, while if you instead select Created by this column will display the amount of accounts each user has created.
Once you’ve finished, click Save to save your parameter within your table. You’ll now see it displayed under the Parameters section and as a column in the Preview section. In this way you can add all the parameters which you’d like to display as columns in your KPI table. Under Parameters, you can use the arrows next to each parameter to set the order of the columns in your table. You can also remove parameters by using the trash icon.
Follow the next steps to add calculated values to your table and filter the rows included in your table.
Formulas
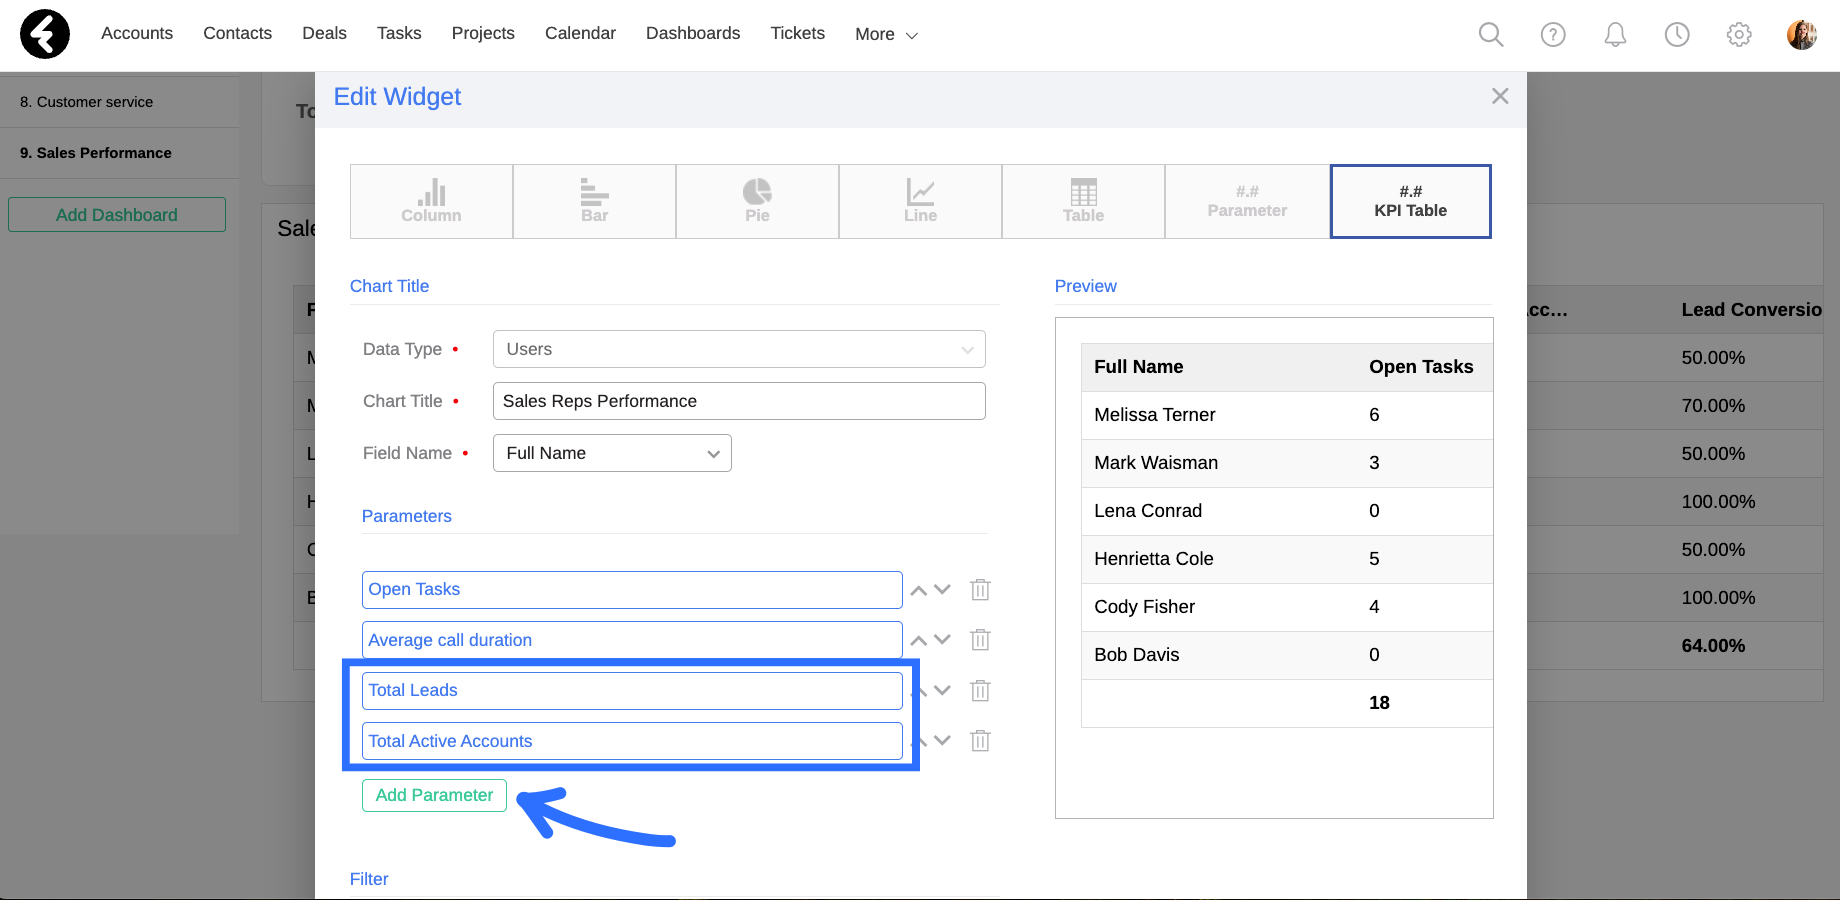
In addition to displaying prebuilt parameters, you can also use your KPI table to display calculated formulas. These formulas are built by using the parameters which are already set as parameters in your table. The first step to creating a formula is choosing the information you’d like to calculate. For example, let’s create a formula which calculates the conversion rate of leads into active accounts for each user. To start, follow the steps above to add both the Total Leads and the Total Active Accounts parameters to your KPI table, as these are the parameters you’ll need in order to calculate the conversion rate. Then click the Add Parameter button to start building your formula.
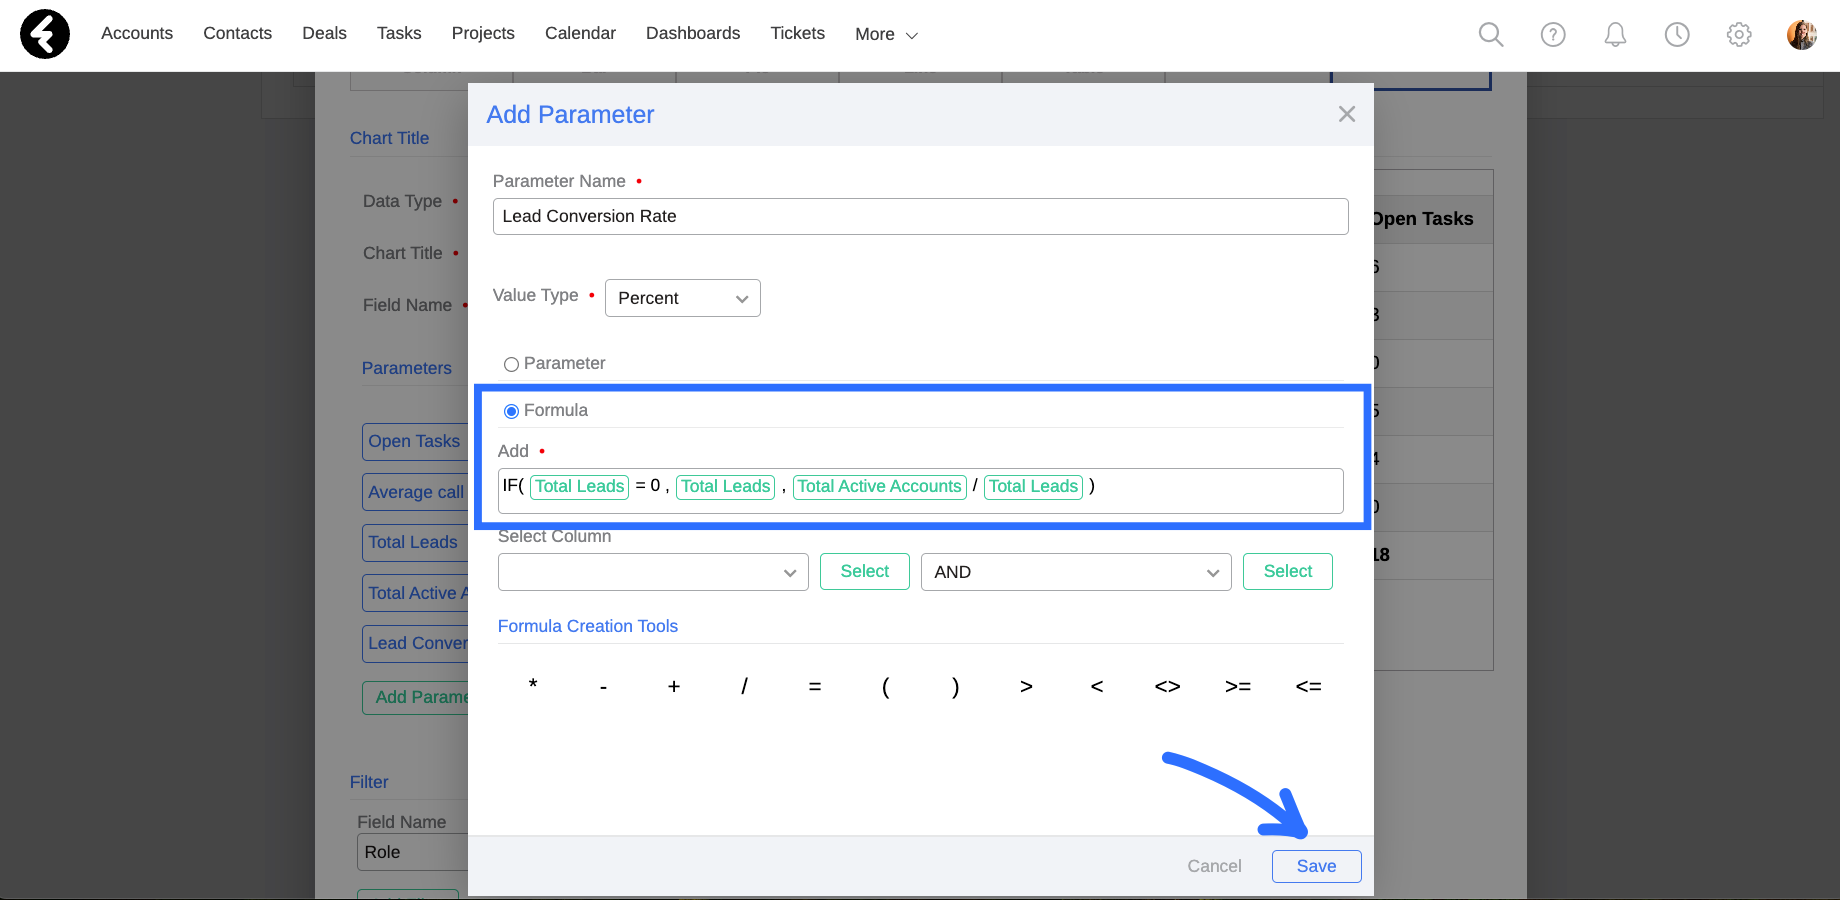
Set the Parameter Name to the outcome of your formula, in this case “Lead Conversion Rate”. Then set the Value Type, which is explained above, to Percent. You can now choose the Formula option by clicking the circle next to it. This will open the following sections:
- Add: This is the text editor where you’ll build your formula.
- Select Column A: The first dropdown list contains all the parameters which are currently included in your KPI table. By choosing a parameter and clicking Select, it will be added to the Add editor. Parameters will be displayed as green boxed text within the editor.
- Select Column B: The second dropdown list contains functions which you can use within your formula, such as AND, OR, and NOT. By choosing one and clicking Select, it will be added to the Add editor. Each function will include the build you should use to create your function.
- Formula Creation Tools: Here you’ll find a list of different operators, which you can click on to add to the Add editor and use within your function.
Let’s continue our above example to understand the process. To calculate the conversion rate, you’ll need to divide the amount of active accounts by the amount of lead. However, when dividing, you’ll need to first make sure that the denominator, which is the amount of leads, is not equal to zero. This will ensure that your formula will not result in an error as it will never try to divide by zero.
To build this function, first use the Select Column B section to add the IF function, which will appear as IF(expression, if_result, else_result). Now replace each section of the function with the relevant parameters as follows:
- expression: Here add the Total Leads = 0 option. This will check if the total amount of leads is equal to zero.
- if_result: This result will be displayed if the expression set before it is true. Add the Total Leads parameter, which will be equal to zero using the above example. In this way if the total leads are equal to zero, nothing will error and the number zero will be displayed.
- else_result: This result will be used if the expression set before it is false. In the example above, this means the Total Leads parameter does not equal zero. You can now add the conversion rate formula, which is Total Active Accounts / Total Leads.
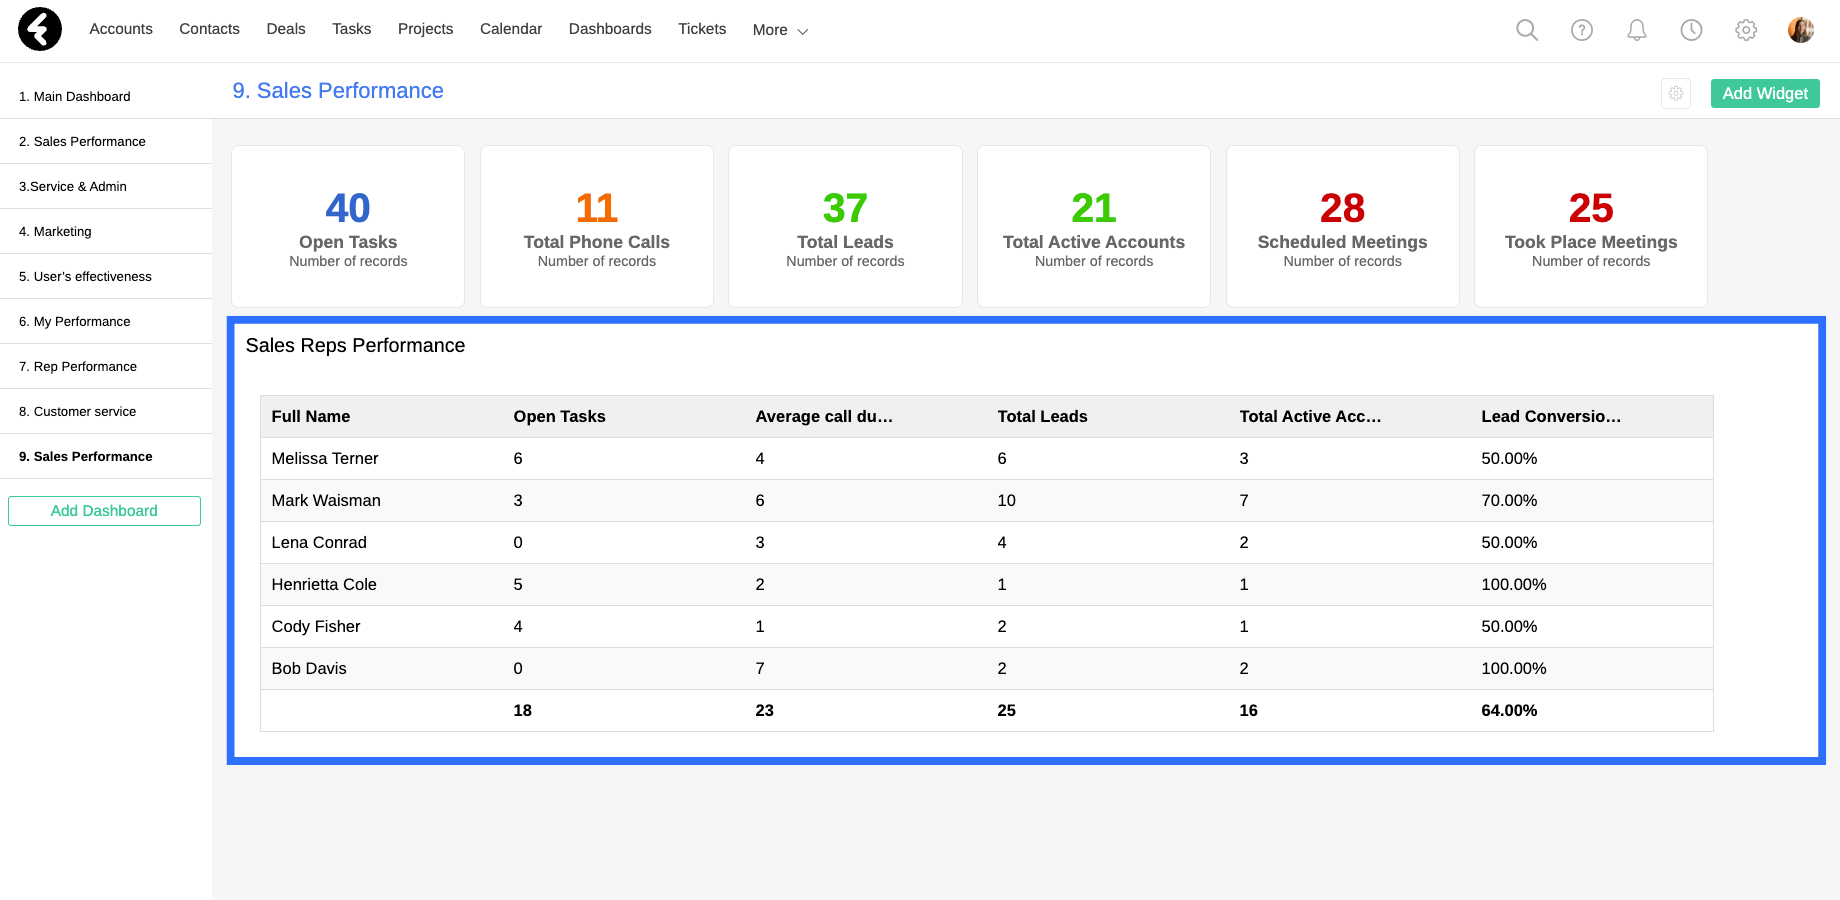
Your final formula should read IF(Total Leads = 0, Total Leads, Total Active Leads / Total Leads). Be sure to click Save once your formula is set up, and then save your new KPI table widget.
In this way your formula will display zero if there are no new leads, and if not it will show the total conversion rate by percentage of leads into active accounts. For example, Melissa has six total leads and three active accounts, so her conversion rate is 50%.
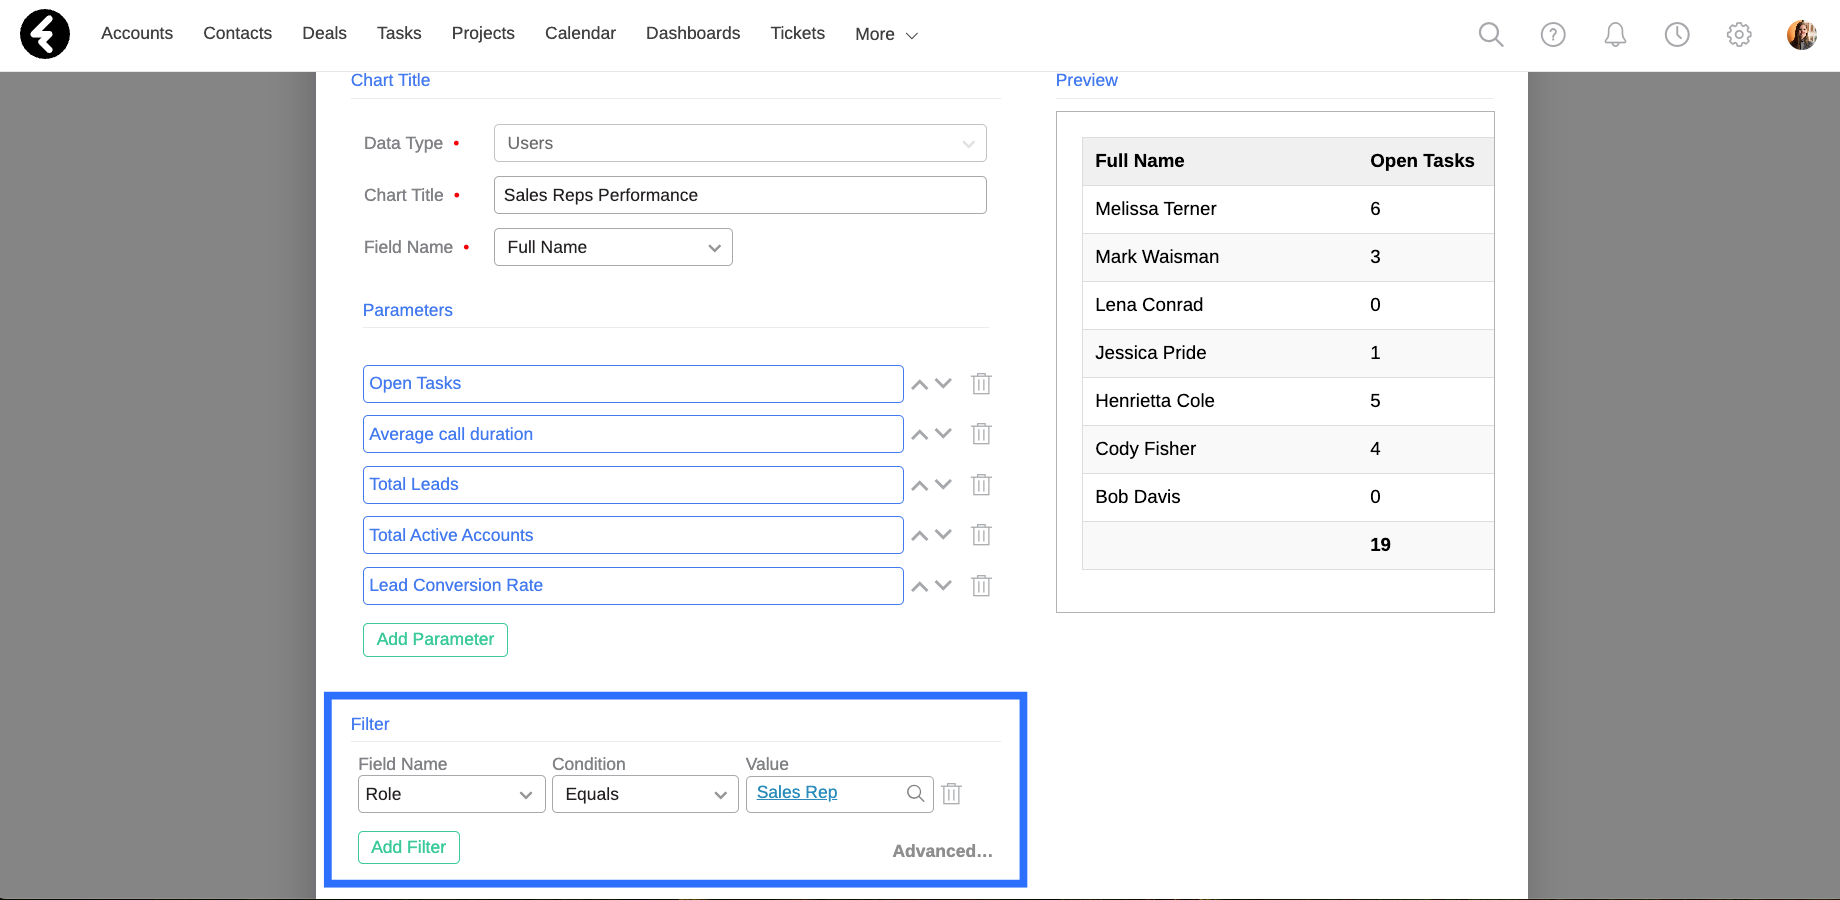
Filters
Like in any other widget, you can use the Filter option to set which records will be included in your table. For example, by adding the Role Equals Sales Rep filter to the user example above, your table will only create rows for users who are sales reps. Use filters to make sure your tables only include relevant information. You can learn more about how to use filters here.